San Diego State’s ‘research hub’ visualizes latest COVID-19 data

San Diego State University on Tuesday announced the creation of a new website to help monitor and visualize outbreak patterns of the coronavirus in San Diego County.
Built by SDSU faculty, staff and students, the “Research HUB for COVID-19” aims to serve as a single source for data on the pandemic to inform San Diego residents about the challenges and problems their communities are facing and to reduce the spread of misinformation.
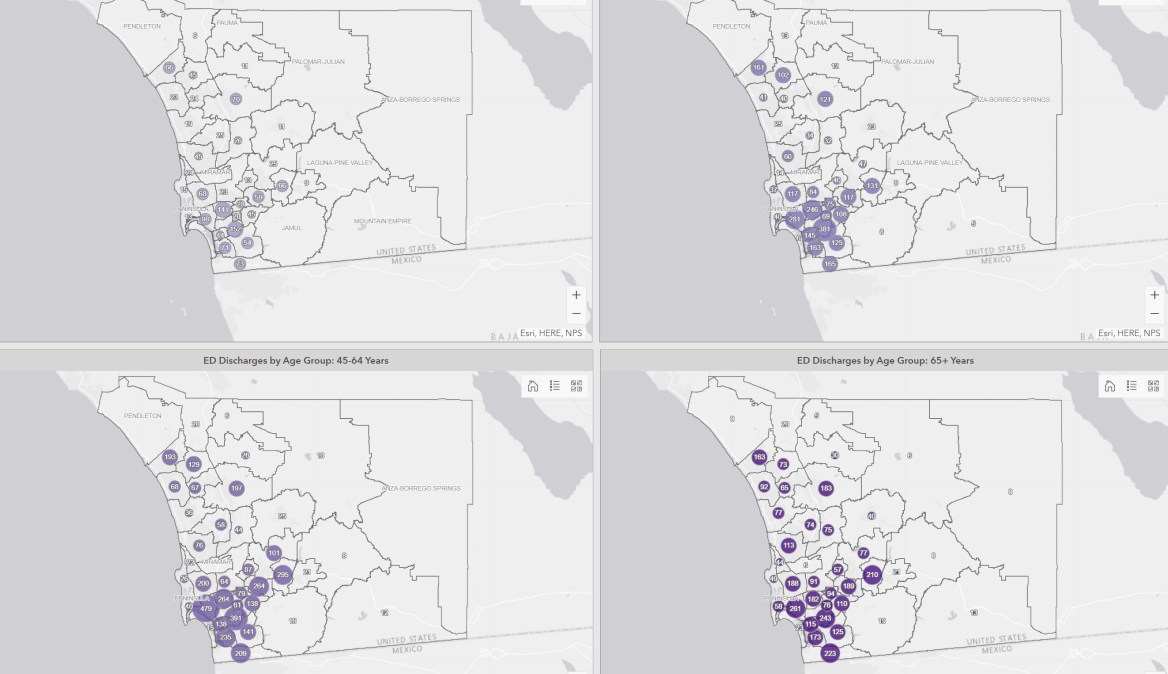
The hub will use data collected from the county’s emergency and health departments and social media create maps depicting which of San Diego’s populations are most vulnerable to the effects of COVID-19 and visualize the spread of confirmed cases. The hub will also house a timeline of major policies and events related to the pandemic for 16 major cities within county lines.
“As a cartographer and a data scientist, I want to emphasize that data visualization is a very powerful tool to help us make timely decisions,” Ming-Hsiang Tsou, director of The Center for Human Dynamics in the Mobile Age at San Diego State University, said in a press release.
The hub’s vulnerability maps, created by third-year SDSU geography student Jessica Embury, will allow researchers to analyze populations with chronic medical conditions, such as heart disease and hypertension, to assess their vulnerability to COVID-19. It will also examine groups such as homeless people and prison inmates, Embury said. A ZIP code map within the hub, meanwhile, is updated daily to allow users to see the spread of confirmed cases.
“We hope this research hub can provide valuable information and research tools to the public and our research community in order to track and analyze COVID-19 outbreaks more effectively,” Tsou said.


